The Berlin office for statistics Amt für Statistik Berlin-Brandenburg have recently released numbers about traffic accidents in Berlin. The good news is: the overall trend seems to be that numbers are declining.
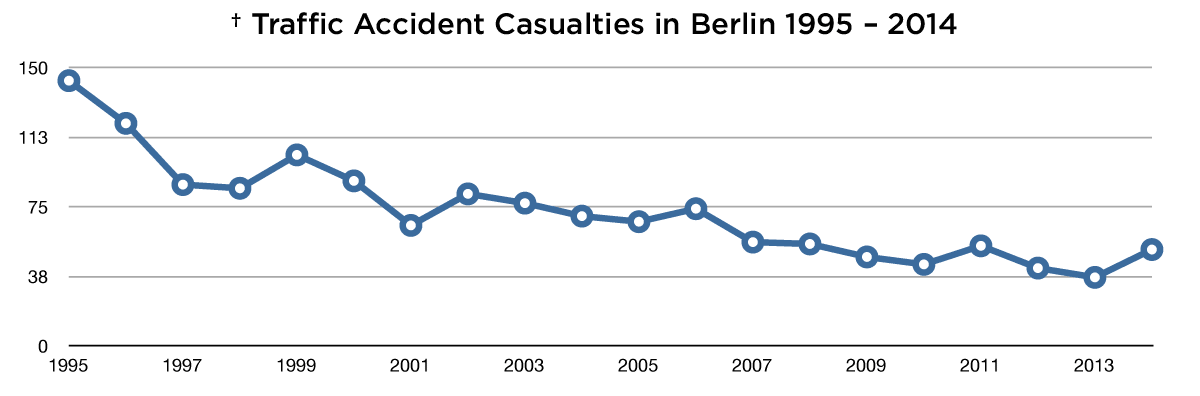
graph of fatal traffic accidents in Berlin: casualties between 1995 – 2014 // data CC BY Amt für Statistik Berlin-Brandenburg // graph by nuberlin.com
While in 1995 over 140 people died in traffic accidents in Berlin, about 20 years later that number is down to ‘only’ 52 casualties. The bad news: that is still one person killed in Berlin traffic each week!
| year | number of casualties | |
| 1995 | 143 | |
| 1996 | 120 | |
| 1997 | 87 | |
| 1998 | 85 | |
| 1999 | 103 | |
| 2000 | 89 | |
| 2001 | 65 | |
| 2002 | 82 | |
| 2003 | 77 | |
| 2004 | 70 | |
| 2005 | 67 | |
| 2006 | 74 | |
| 2007 | 56 | |
| 2008 | 55 | |
| 2009 | 48 | |
| 2010 | 44 | |
| 2011 | 54 | |
| 2012 | 42 | |
| 2013 | 37 | |
| 2014 | 52 |
So if you happen to be out in the streets of Berlin, whether walking, by bike or by car – please be careful. Even though Berlin seems to be such a relaxed and nice city, there is still also ‘sh;t happening’.
see also:
from the archive: